
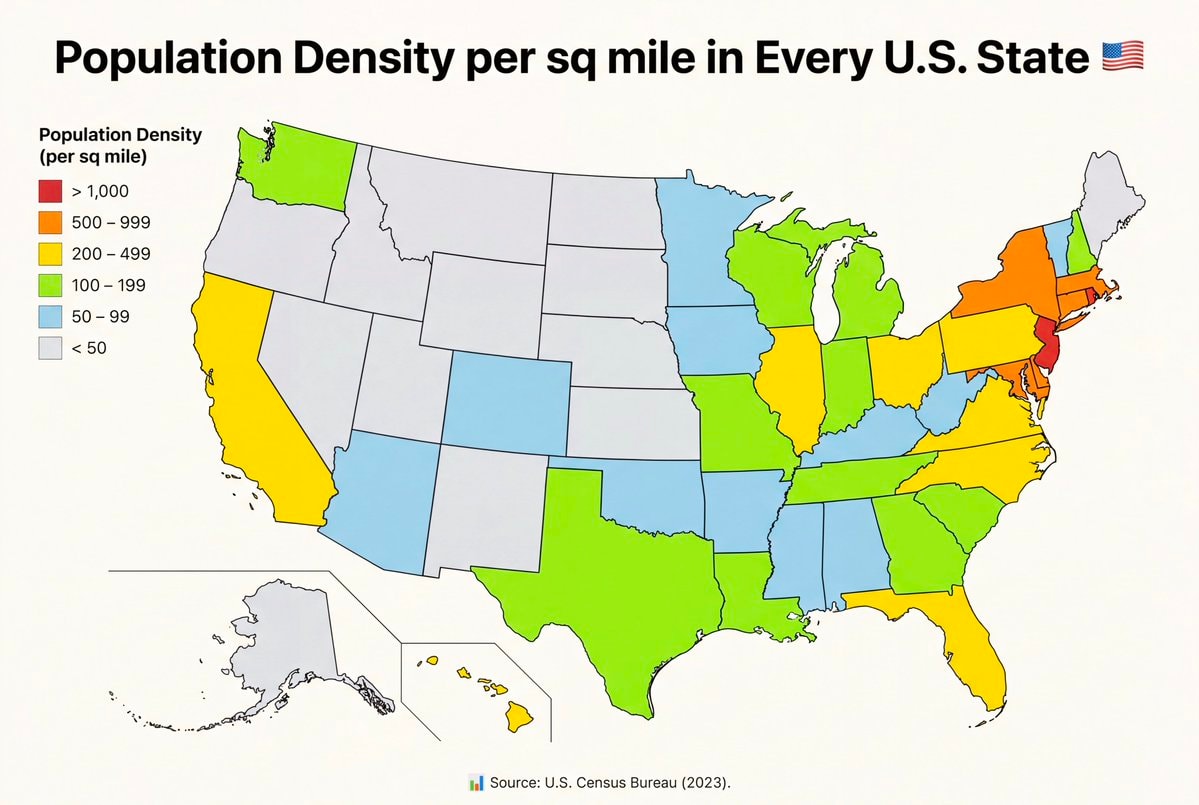
@savageupdatesActually this board breaks down population density per sq mile in every U.S. State
Ver publicação original@savageupdatesActually this board breaks down population density per sq mile in every U.S. State
Ver publicação originalFoto de @savageupdates· Oct 27, 2026· United States
The image is a map of the United States showing population density per square mile by state. States are color-coded according to density ranges from less than 50 to over 1,000 people per square mile. The style is informational and data-driven. The legend clearly labels the color-coded density ranges. ON-SCREEN TEXT: Population Density per sq mile in Every U.S. State Source: U.S. Census Bureau (2023).
 Flavio Bolsonaro whereabouts unknown
 2Flávio Bolsonaro US travel allegation
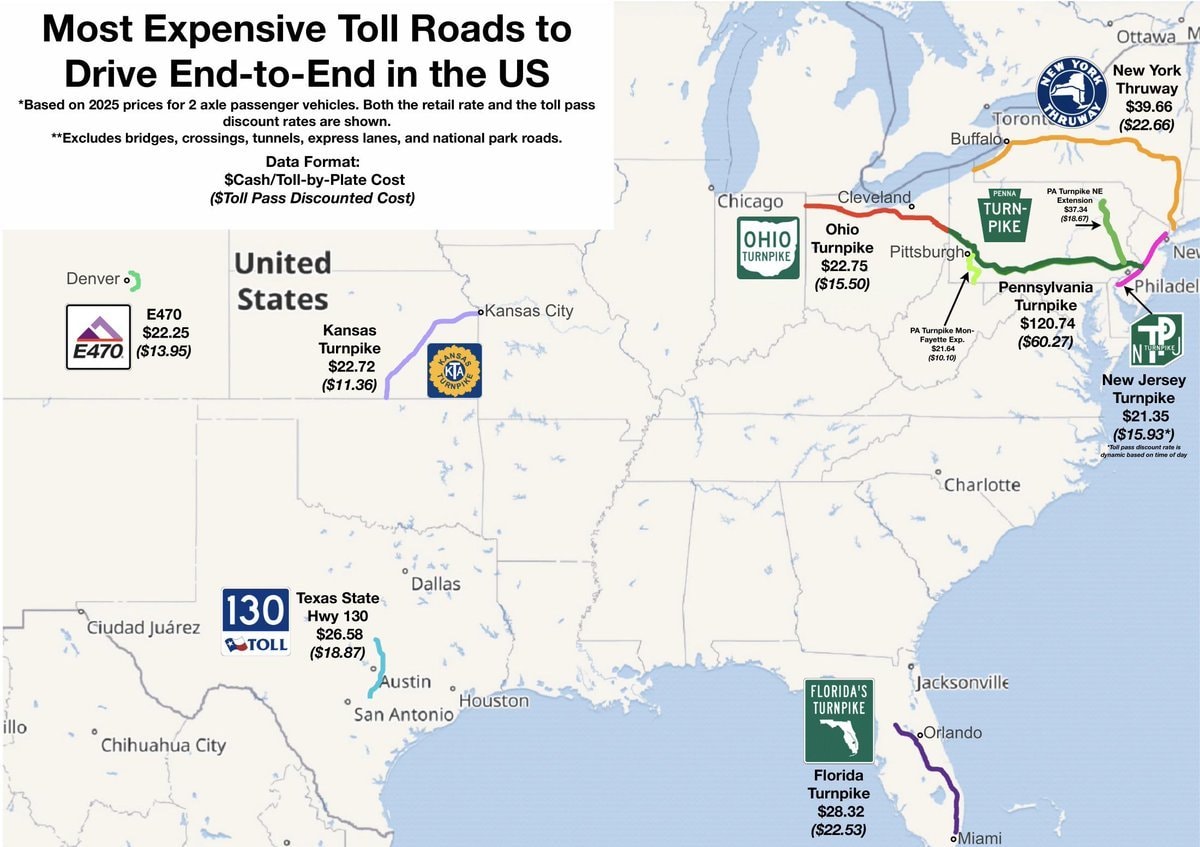 most expensive US toll roads map
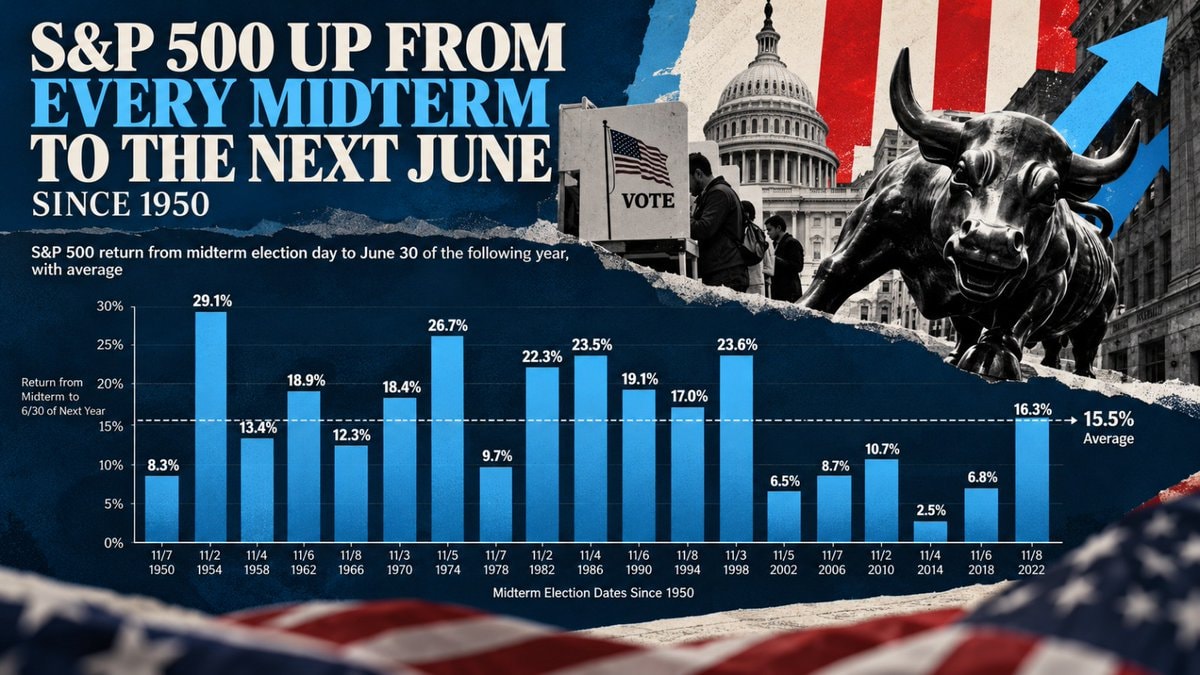 S&P 500 midterm election gains since 1950
 4NICU Halloween costumes US
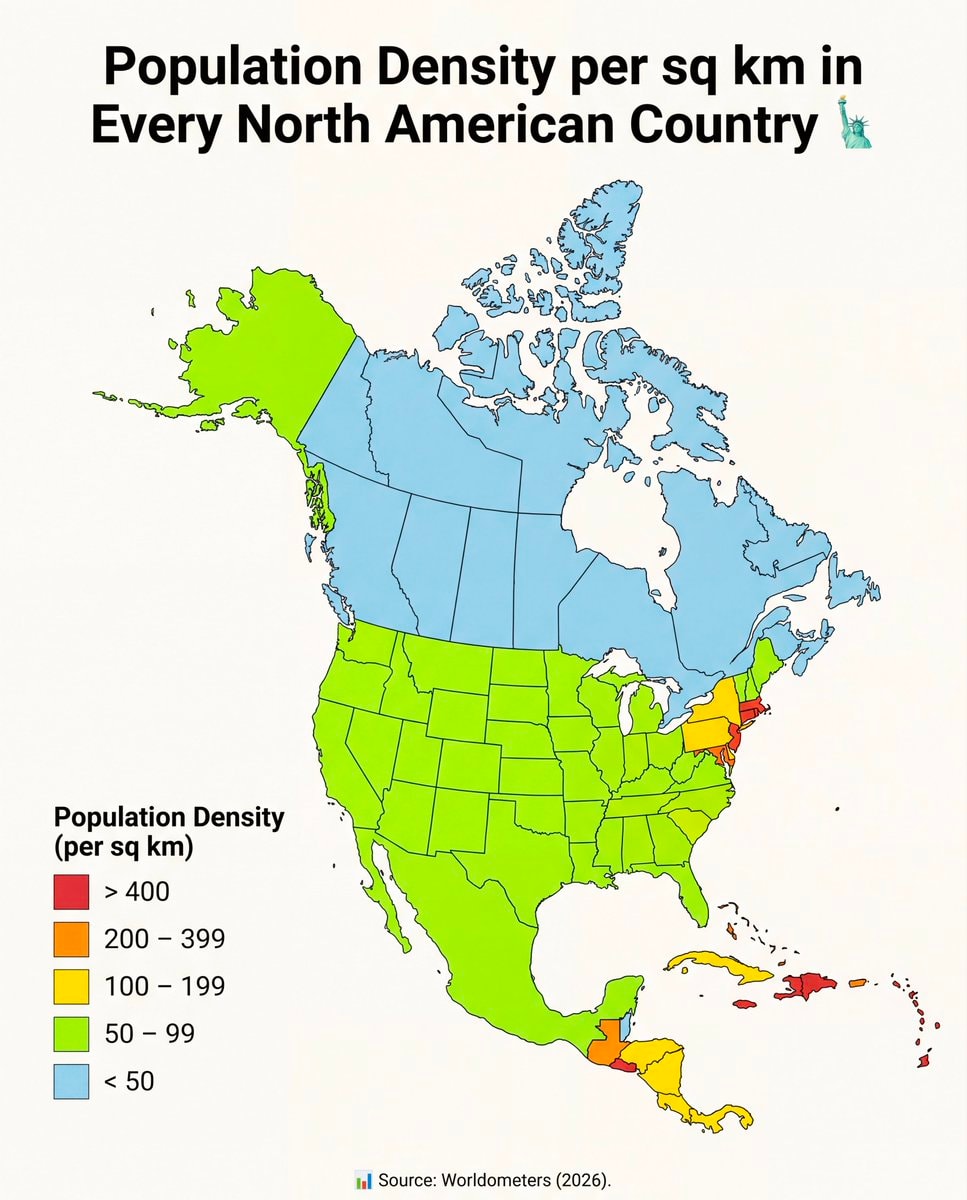 North America population density map
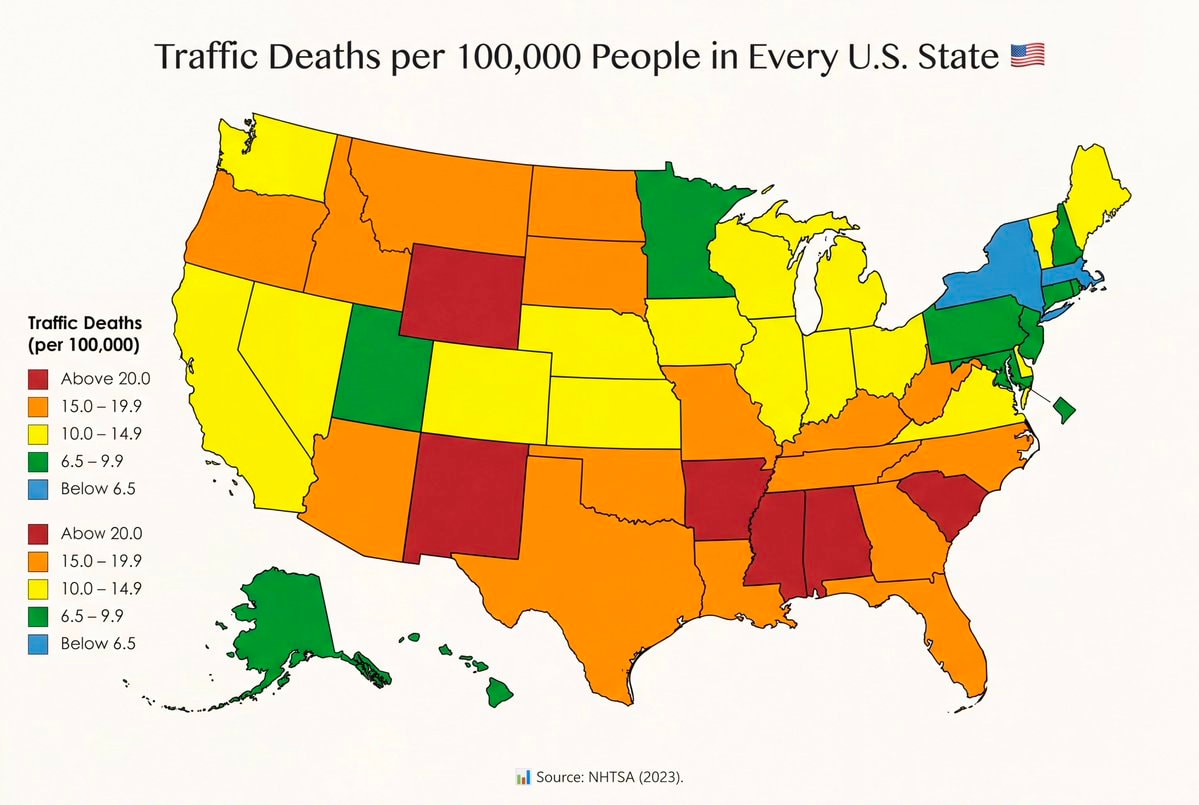 Traffic fatality rates by U.S. State
 US Iran strike tension
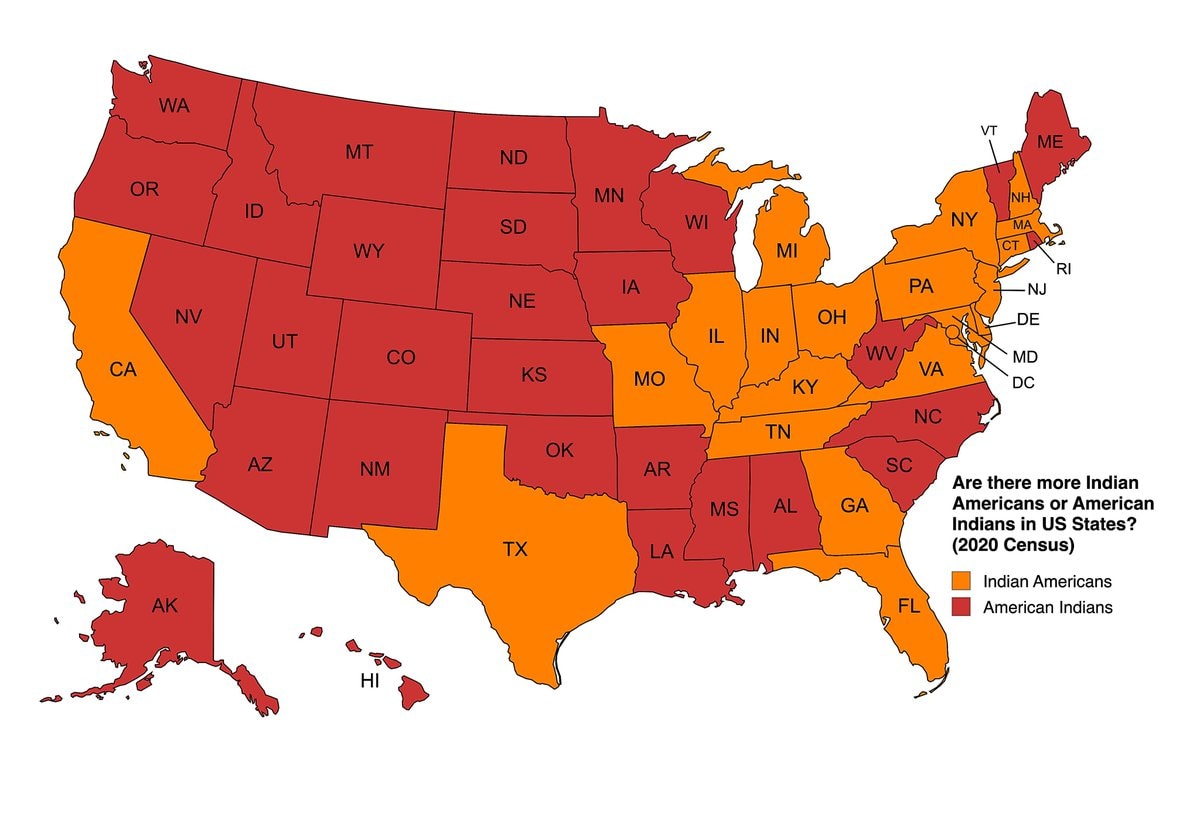 Indian Americans vs American Indians by US state
 AOC on a past gay US President
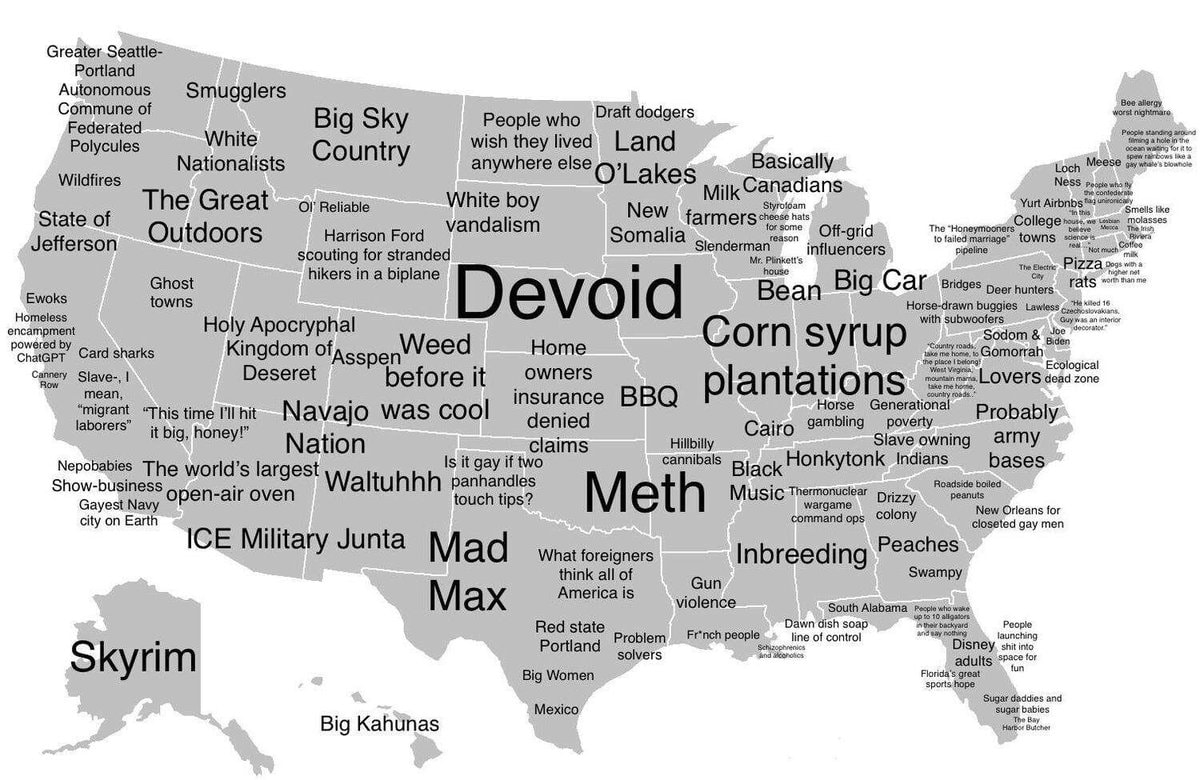 How Americans see America map
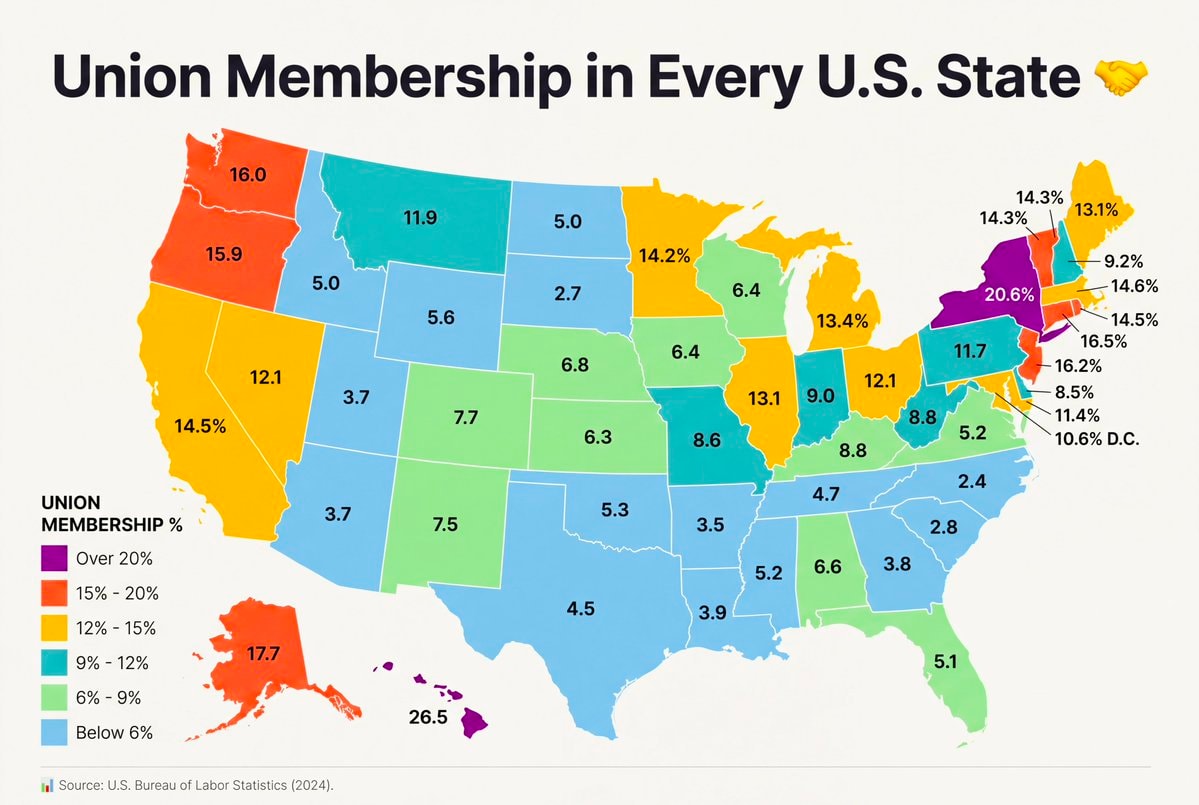 Union Membership by U.S. State
 2US citizenship grants drop 72% in 2026
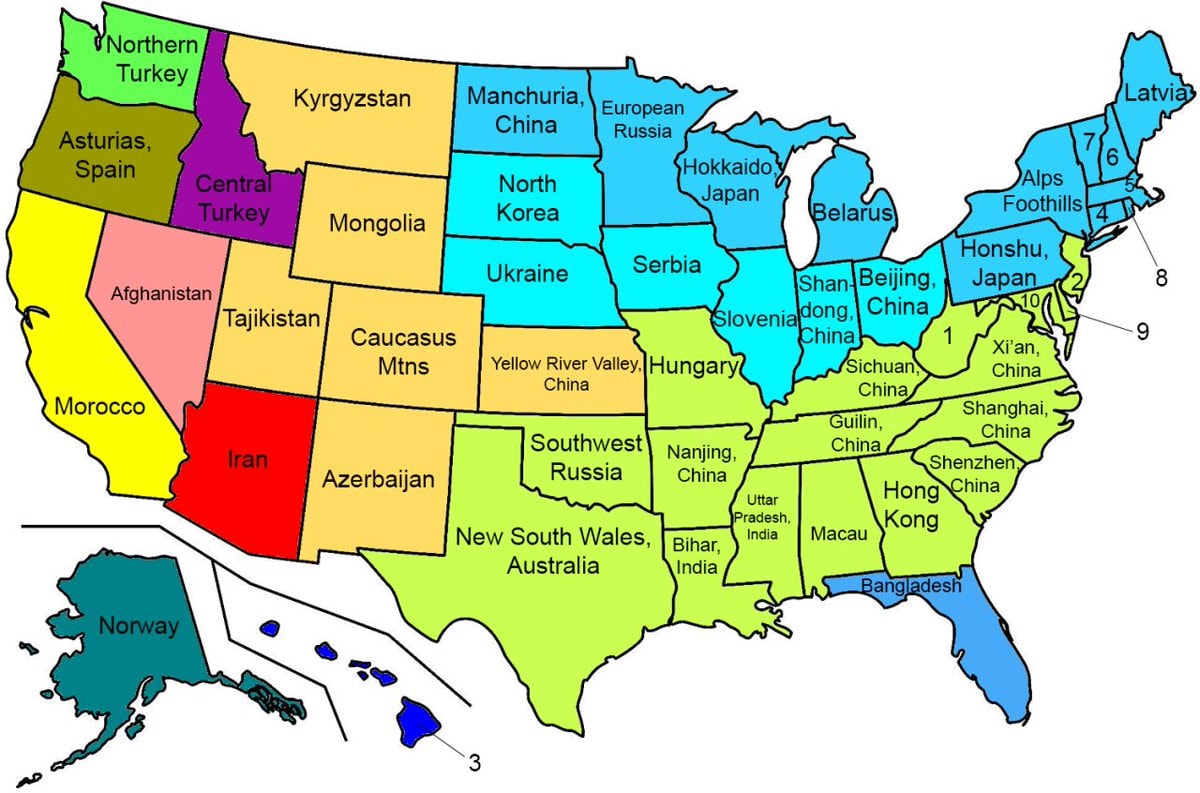 US states with similar climates worldwide
 2Halloween candy prices up 44%
 Zelensky on Ukraine US relations and peace
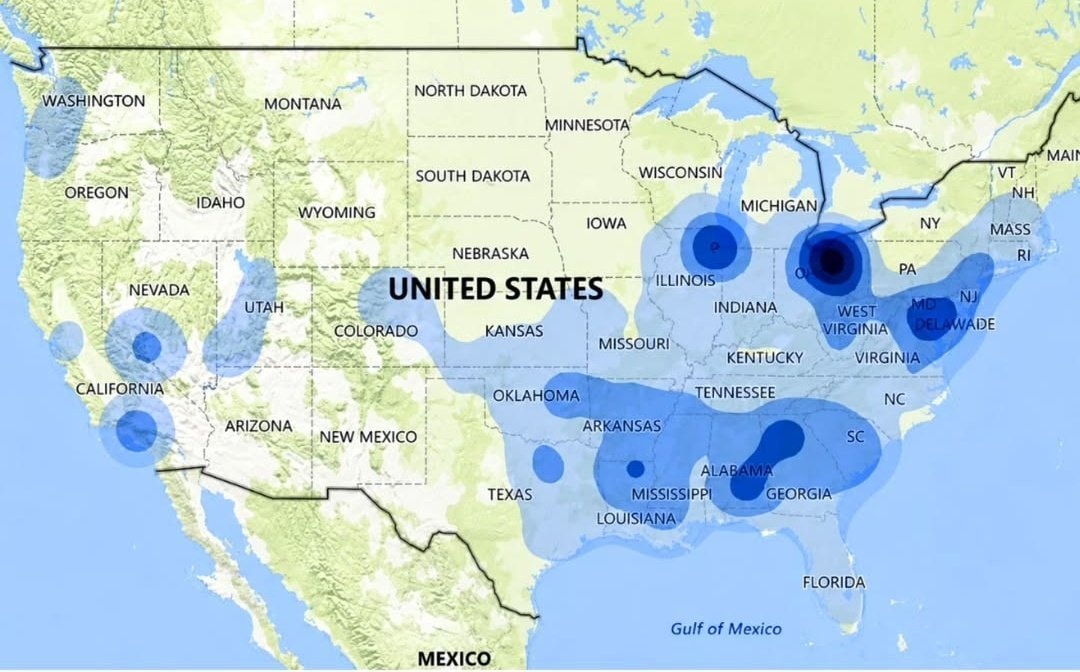 Speeding ticket map of the US
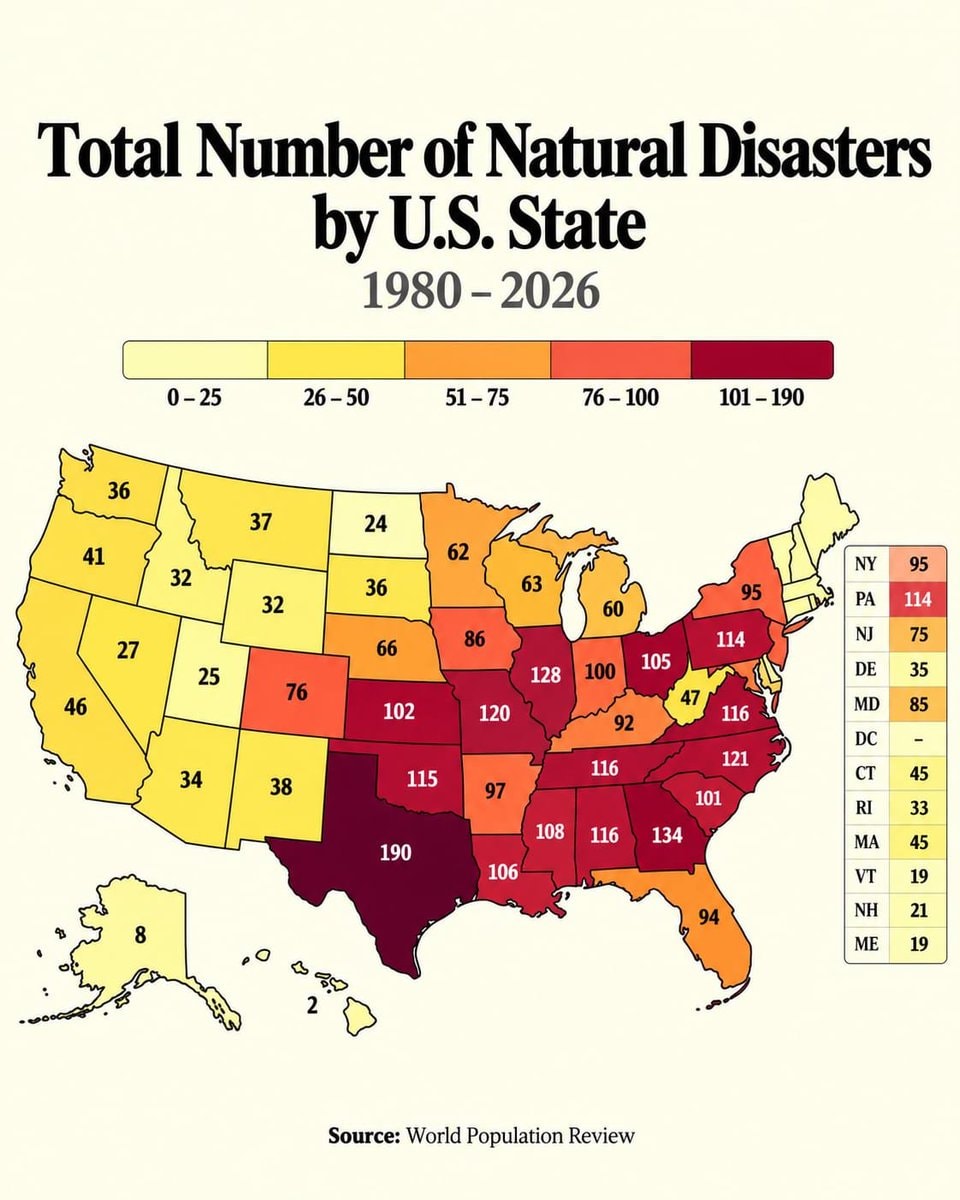 Natural disasters 1980 to 2026
@savageupdatesActually this board breaks down population density per sq mile in every U.S. State
Ver publicação originalFoto de @savageupdates· Oct 27, 2026· United States
The image is a map of the United States showing population density per square mile by state. States are color-coded according to density ranges from less than 50 to over 1,000 people per square mile. The style is informational and data-driven. The legend clearly labels the color-coded density ranges. ON-SCREEN TEXT: Population Density per sq mile in Every U.S. State Source: U.S. Census Bureau (2023).
Ainda não há comentários. Seja o primeiro!
Flavio Bolsonaro whereabouts unknown2Flávio Bolsonaro US travel allegationmost expensive US toll roads mapS&P 500 midterm election gains since 19504NICU Halloween costumes USNorth America population density mapTraffic fatality rates by U.S. StateUS Iran strike tensionIndian Americans vs American Indians by US stateAOC on a past gay US PresidentHow Americans see America mapUnion Membership by U.S. State2US citizenship grants drop 72% in 2026US states with similar climates worldwide2Halloween candy prices up 44%Zelensky on Ukraine US relations and peaceSpeeding ticket map of the USNatural disasters 1980 to 2026
Ainda não há comentários. Seja o primeiro!