iFANN
    Buscar no iFANN...
    Entrar
    Início
    Notícias
    Vídeos
    Fotos
    GIFs
    Explorar
    Enquetes
    Prêmios
    iFAMOUS
    Wiki
    Anime
    Salas
    Notificações
    Mensagens
    Salvos
    Perfil
    WikiPrêmiosiFAMOUSRankingsSetoresRecompensas para criadoresRecompensas para usuáriosTermosPrivacidadeDiretrizes da comunidadeRemoção / DMCAAjudaDesenvolvedores

    © 2026 iFANN

    Início
    Buscar
    Mensagens
    Alertas
    Perfil
    Foto
    Not A Newt
    Not A Newt@not_a_newt13h
    🌍China🌍United States🌍Germany
    China US Germany nuclear generation charts

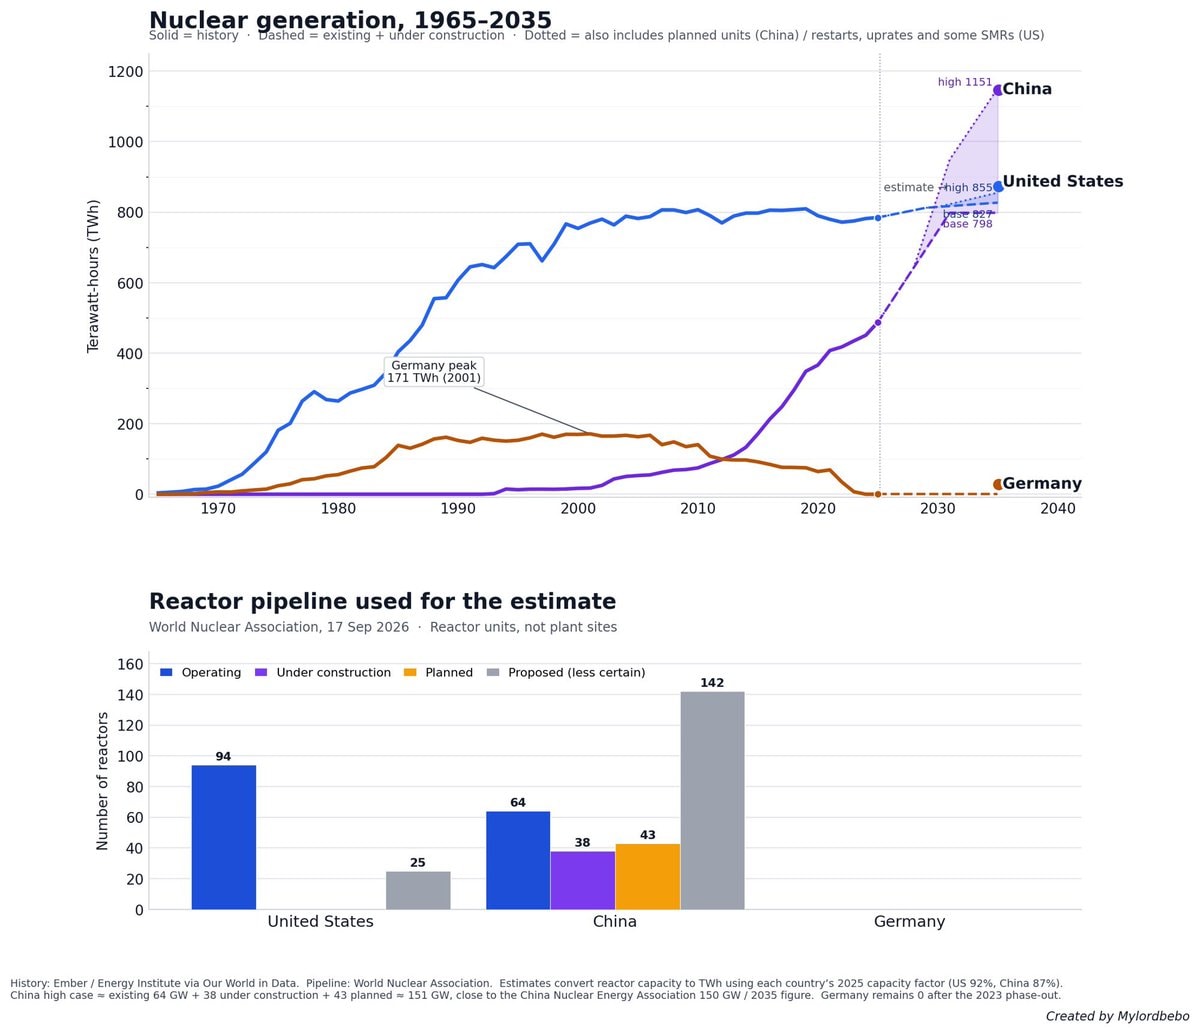
    @not_a_newt☢️ While Germany shut down its nuclear plants and even solar fields go bankrupt… the US and China expand their nuclear use. China is projected to double its nuclear energy output in the next decade. Remember, there is no high-wealth, low-energy-generation country… wealth always correlates with energy usage/production.

    Ver publicação original

    China US Germany nuclear generation charts

    Foto de @not_a_newt· Sep 26, 2026· China

    Sobre esta foto

    The image displays two charts about nuclear generation and reactor pipelines. The top chart shows nuclear generation in Terawatt-hours from 1965 to 2035 for China, the United States, and Germany. The bottom chart shows the reactor pipeline for the estimate, detailing operating, under construction, planned, and proposed reactors for the United States, China, and Germany. The mood is informative and data-driven, with a clean, infographic style. A notable detail is the projected steep increase in nuclear generation for China and the United States compared to Germany's decline. The on-screen text includes "Nuclear generation, 1965-2035", "Germany peak 171 TWh (2001)", "Reactor pipeline used for the estimate", "World Nuclear Association, 17 Sep 2026", "Reactor units, not plant sites", and "Created by Mylordbebo".

    Ver todas as fotos de China

    ?

    Ainda não há comentários. Seja o primeiro!

    Mais fotos de China

    Ver todas as fotos de China
    Netherlands vs Germany UEFA Nations LeagueNetherlands vs Germany UEFA Nations LeagueKai Havertz injury updateKai Havertz injury updateCoal miner Germany 1958Coal miner Germany 1958Jürgen Klopp on Gakpo goal2Jürgen Klopp on Gakpo goalCoachman Germany2Coachman GermanyMeersburg Lake Constance BodenseeMeersburg Lake Constance BodenseeOberstdorf Allgäu GermanyOberstdorf Allgäu GermanyMerz political removal GermanyMerz political removal GermanyCochem Moselle River GermanyCochem Moselle River GermanyGermany aerial view2Germany aerial viewAfD BSW Saxony-Anhalt coalitionAfD BSW Saxony-Anhalt coalitionBerlin debt vs GDP lift chartBerlin debt vs GDP lift chartEurope map 19762Europe map 1976Berlin election results 2026Berlin election results 2026Cologne cathedral bridge2Cologne cathedral bridgeFriedrich Merz party collapseFriedrich Merz party collapseAfD wins Mecklenburg-Vorpommern electionAfD wins Mecklenburg-Vorpommern electionCDU at 5% in Mecklenburg-Vorpommern 2026CDU at 5% in Mecklenburg-Vorpommern 2026
    Foto
    Not A Newt
    Not A Newt@not_a_newt13h
    🌍China🌍United States🌍Germany
    China US Germany nuclear generation charts

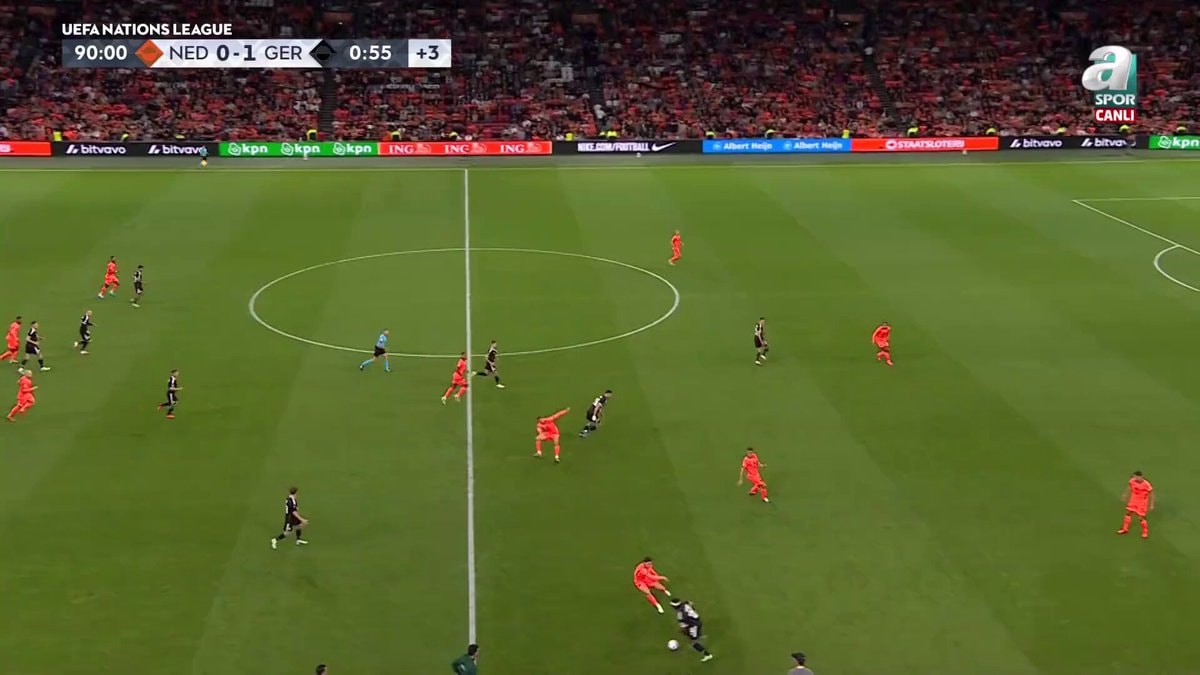
    @not_a_newt☢️ While Germany shut down its nuclear plants and even solar fields go bankrupt… the US and China expand their nuclear use. China is projected to double its nuclear energy output in the next decade. Remember, there is no high-wealth, low-energy-generation country… wealth always correlates with energy usage/production.

    Ver publicação original

    China US Germany nuclear generation charts

    Foto de @not_a_newt· Sep 26, 2026· China

    Sobre esta foto

    The image displays two charts about nuclear generation and reactor pipelines. The top chart shows nuclear generation in Terawatt-hours from 1965 to 2035 for China, the United States, and Germany. The bottom chart shows the reactor pipeline for the estimate, detailing operating, under construction, planned, and proposed reactors for the United States, China, and Germany. The mood is informative and data-driven, with a clean, infographic style. A notable detail is the projected steep increase in nuclear generation for China and the United States compared to Germany's decline. The on-screen text includes "Nuclear generation, 1965-2035", "Germany peak 171 TWh (2001)", "Reactor pipeline used for the estimate", "World Nuclear Association, 17 Sep 2026", "Reactor units, not plant sites", and "Created by Mylordbebo".
    Ver todas as fotos de China

    ?

    Ainda não há comentários. Seja o primeiro!

    Mais fotos de China

    Ver todas as fotos de China
    Netherlands vs Germany UEFA Nations LeagueNetherlands vs Germany UEFA Nations LeagueKai Havertz injury updateKai Havertz injury updateCoal miner Germany 1958Coal miner Germany 1958Jürgen Klopp on Gakpo goal2Jürgen Klopp on Gakpo goalCoachman Germany2Coachman GermanyMeersburg Lake Constance BodenseeMeersburg Lake Constance BodenseeOberstdorf Allgäu GermanyOberstdorf Allgäu GermanyMerz political removal GermanyMerz political removal GermanyCochem Moselle River GermanyCochem Moselle River GermanyGermany aerial view2Germany aerial viewAfD BSW Saxony-Anhalt coalitionAfD BSW Saxony-Anhalt coalitionBerlin debt vs GDP lift chartBerlin debt vs GDP lift chartEurope map 19762Europe map 1976Berlin election results 2026Berlin election results 2026Cologne cathedral bridge2Cologne cathedral bridgeFriedrich Merz party collapseFriedrich Merz party collapseAfD wins Mecklenburg-Vorpommern electionAfD wins Mecklenburg-Vorpommern electionCDU at 5% in Mecklenburg-Vorpommern 2026CDU at 5% in Mecklenburg-Vorpommern 2026