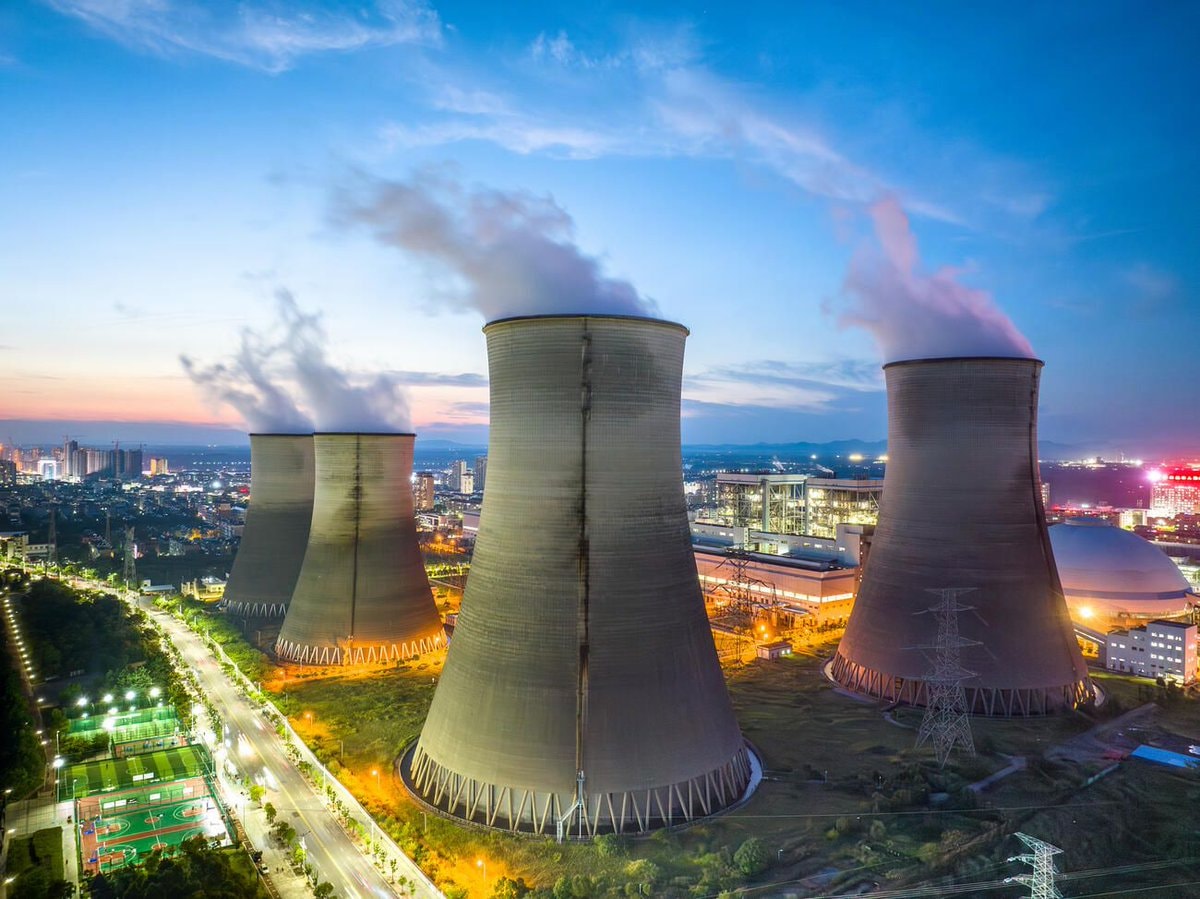
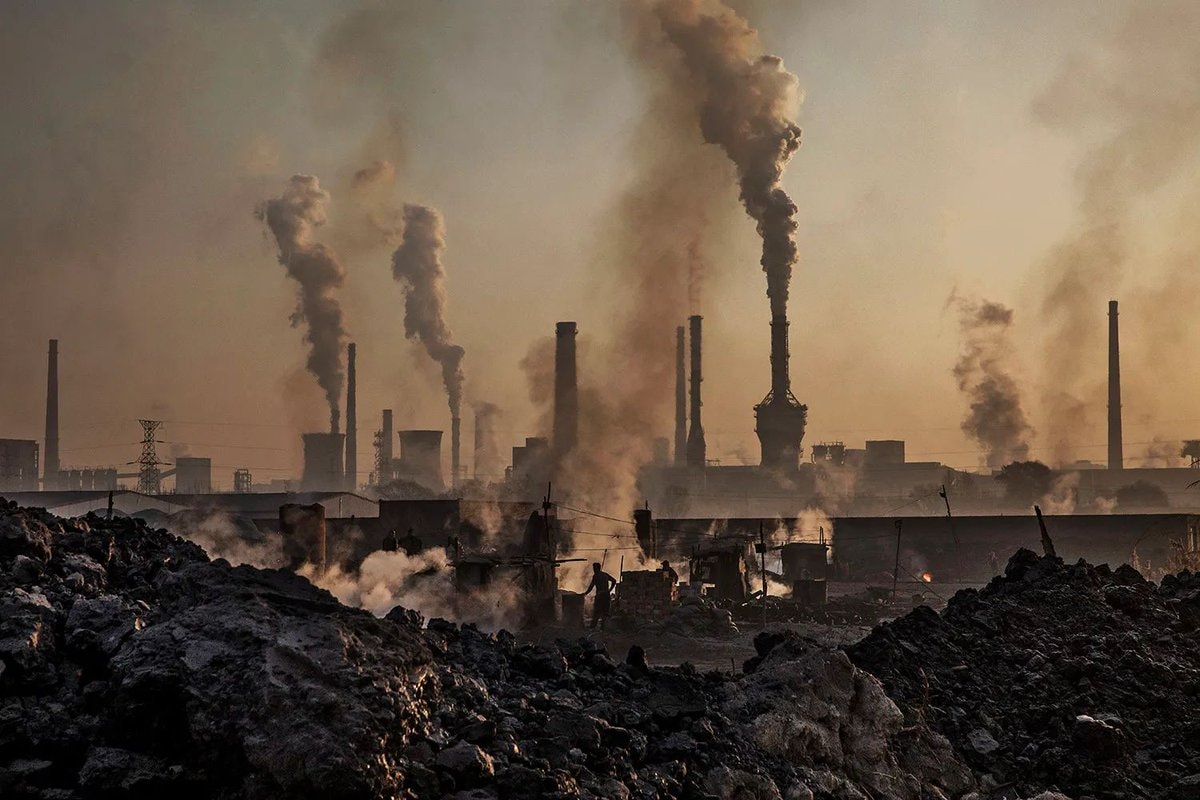
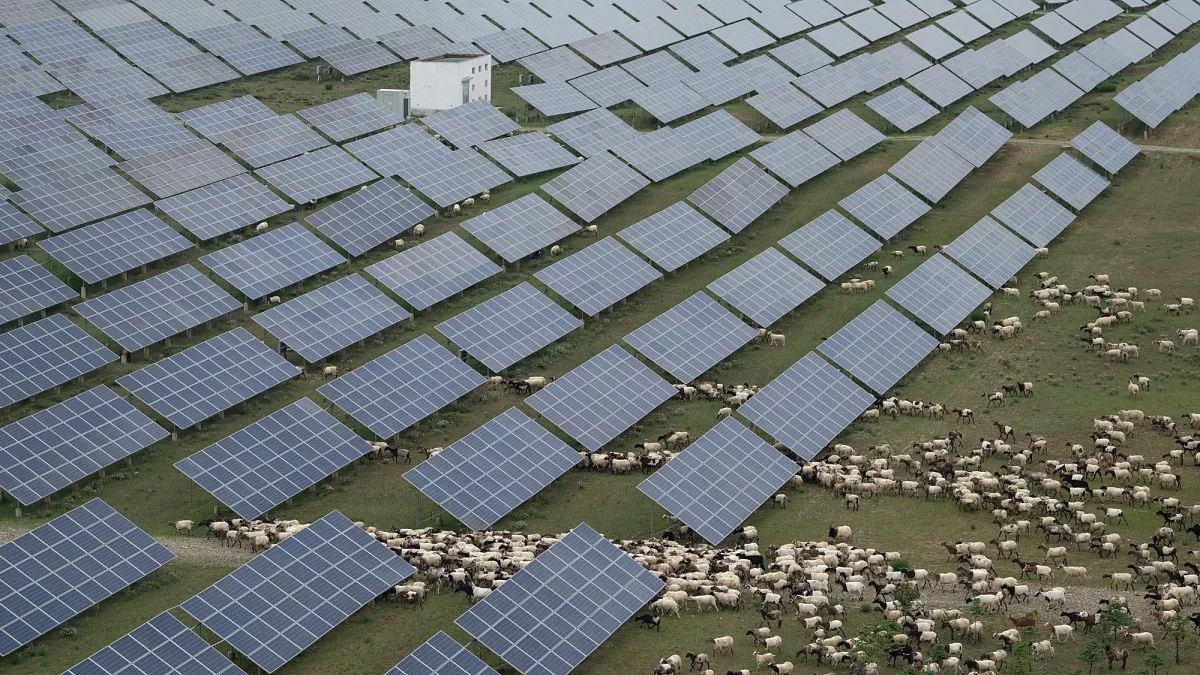
@not_a_charmThe U.S. and China each control exactly four of the eight largest energy sources globally, yet their strategies diverge completely. America dominates oil at 20.9% of production, natural gas at 25.6%, nuclear generation at 29.0%, and biofuels output at 36.5%. China leads coal production with 52.4%, solar generation at 41.7%, wind at 41.6%, and hydro at 31.1%. Market concentration varies significantly across these sectors. Coal is heavily concentrated with China, India, and Indonesia accounting for roughly 71%. Biofuels top three countries hold 69%. Wind concentration sits at 64% while solar reaches 62%. Nuclear production concentration hits 60%. Oil remains the most distributed at just 43%. The fuels where China leads are also the most lopsided, meaning global markets shift when they move on coal or solar. Oil is the only category where no single nation can corner the market entirely. Trajectories show China's system expanding by stacking coal and renewables to power factories. The U.S. system barely grew in total size but became cleaner and more efficient as gas replaced coal. This aligns with usage patterns. China's grid runs factories, steel production, and the solar panels and batteries it exports worldwide. The American grid powers homes, cars, and data centers. Despite a smaller overall grid, the average American consumes about twice the electricity per person compared to someone in China. Same title of world's biggest energy powers. Two completely different bets on how to keep the lights on. Source: VanEck, IEA, Jack Prandelli.
Ver publicação original












Ainda não há comentários. Seja o primeiro!